There isn’t much out there for CyberArk Splunk dashboards, so I figured I’d walk through setting one up to share. This dashboard is very basic in terms of showing CyberArk event data. The hope is that this can help you jump start improved versions for you to utilize and/or share on your own in the future.
Prerequisites —
- CyberArk Vaults configured to send syslog data to your Splunk SIEM.
- Splunk SIEM configured to ingest the logs
- Create 2 Splunk indexes; index=cyberark , and index=cyberark_test
- Vault syslog events generated and within the indexes noted above
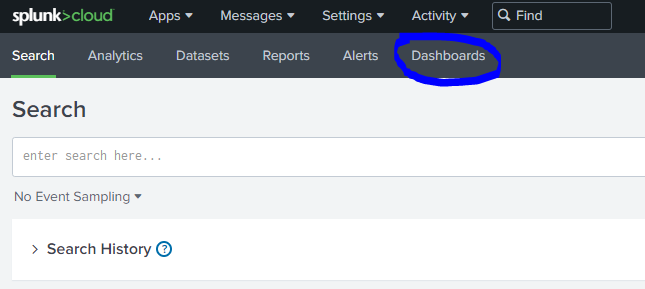
Creating a new dashboard within Splunk—
- Click on Dashboards
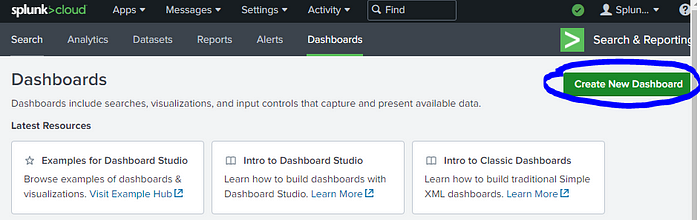
- Click on Create New Dashboard.
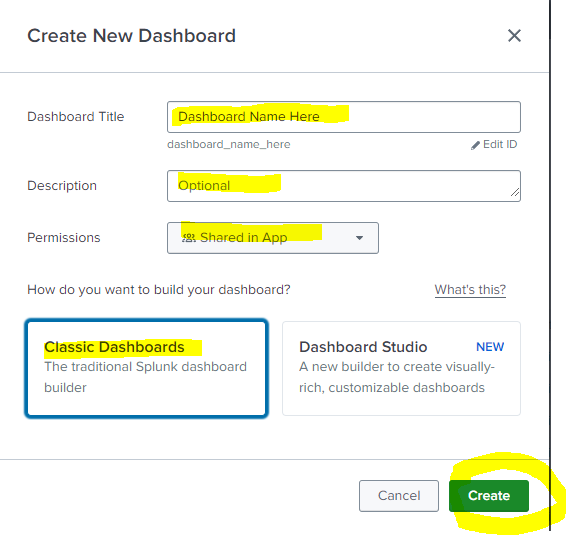
- Choose your options
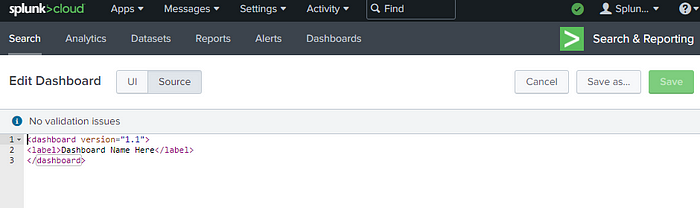
- Your new dashboard was created. Now click Source.
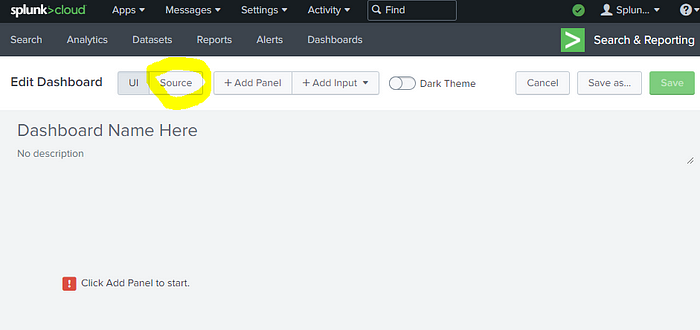
- This is the starter dashboard xml text you’ll see.
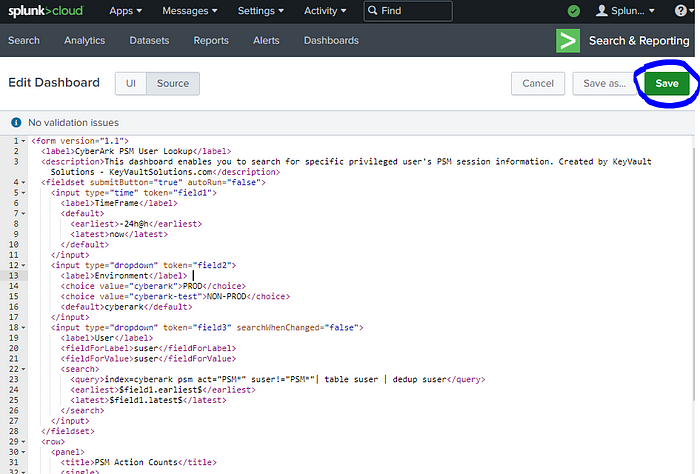
- Using the example Splunk Dashboard xml below, you would copy, then paste into this XML Source field. Then click Save at the top right.
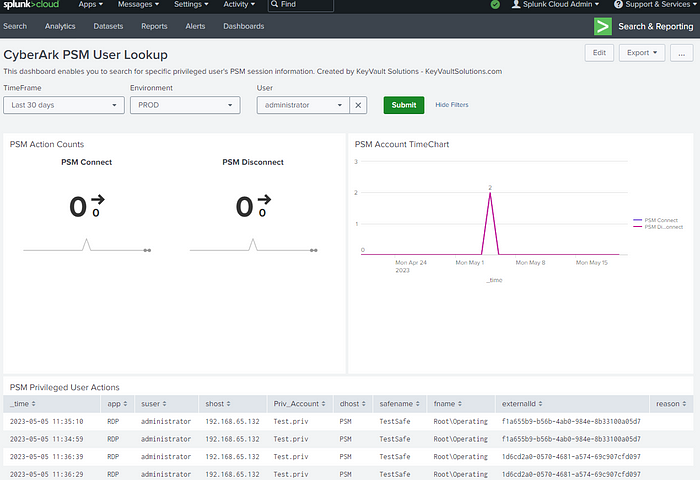
Example Splunk Dashboard — “CyberArk PSM User Lookup“
<form version=”1.1">
<label>CyberArk PSM User Lookup</label>
<description>This dashboard enables you to search for specific privileged user’s PSM session information. Created by KeyVault Solutions — KeyVaultSolutions.com</description>
<fieldset submitButton=”true” autoRun=”false”>
<input type=”time” token=”field1">
<label>TimeFrame</label>
<default>
<earliest>-24h@h</earliest>
<latest>now</latest>
</default>
</input>
<input type=”dropdown” token=”field2">
<label>Environment</label>
<choice value=”cyberark”>PROD</choice>
<choice value=”cyberark_test”>NON-PROD</choice>
<default>cyberark</default>
</input>
<input type=”dropdown” token=”field3" searchWhenChanged=”false”>
<label>User</label>
<fieldForLabel>suser</fieldForLabel>
<fieldForValue>suser</fieldForValue>
<search>
<query>index=cyberark psm act=”PSM*” suser!=”PSM*”| table suser | dedup suser</query>
<earliest>$field1.earliest$</earliest>
<latest>$field1.latest$</latest>
</search>
</input>
</fieldset>
<row>
<panel>
<title>PSM Action Counts</title>
<single>
<search>
<query>index=$field2$ act=”PSM*” | search suser=$field3$ | timechart count by act
</query>
<earliest>$field1.earliest$</earliest>
<latest>$field1.latest$</latest>
<refresh>30s</refresh>
<refreshType>delay</refreshType>
</search>
<option name=”drilldown”>all</option>
<option name=”rangeColors”>[“0x53a051”,”0x0877a6",”0xf8be34",”0xf1813f”,”0xdc4e41"]</option>
<option name=”refresh.display”>progressbar</option>
<option name=”showTrendIndicator”>1</option>
<option name=”trellis.enabled”>1</option>
<option name=”trellis.scales.shared”>0</option>
<option name=”trellis.size”>large</option>
</single>
</panel>
<panel>
<title>PSM Account TimeChart</title>
<chart>
<search>
<query>index=$field2$ act=”PSM*” | search suser=$field3$ | timechart count by act
</query>
<earliest>$field1.earliest$</earliest>
<latest>$field1.latest$</latest>
<refresh>30s</refresh>
<refreshType>delay</refreshType>
</search>
<option name=”charting.axisTitleX.visibility”>visible</option>
<option name=”charting.axisTitleY.visibility”>visible</option>
<option name=”charting.axisTitleY2.visibility”>visible</option>
<option name=”charting.chart”>line</option>
<option name=”charting.chart.showDataLabels”>minmax</option>
<option name=”charting.drilldown”>all</option>
<option name=”charting.layout.splitSeries”>0</option>
<option name=”charting.legend.placement”>right</option>
<option name=”refresh.display”>progressbar</option>
<option name=”trellis.enabled”>0</option>
<option name=”trellis.scales.shared”>0</option>
<option name=”trellis.size”>medium</option>
</chart>
</panel>
</row>
<row>
<panel>
<title>PSM Privileged User Actions</title>
<table>
<search>
<query>index=$field2$ psm act=”PSM*” | search suser=$field3$ |rename cs2 as safename |rename duser as Priv_Account | table _time, app, suser, shost, Priv_Account, dhost, safename, fname, externalId, reason
</query>
<earliest>$field1.earliest$</earliest>
<latest>$field1.latest$</latest>
<refresh>30s</refresh>
<refreshType>delay</refreshType>
</search>
<option name=”drilldown”>none</option>
</table>
</panel>
</row>
</form>
Recommended items:
- Ideally you would create a standalone new CyberArk Splunk app, then place these dashboards within that Splunk app’s folder. That way you can control the permissions of who can utilize the CyberArk app, and allows your PAM team freedom to create various dashboards, etc. as needed without being lumped in with other Splunk reports, dashboards, etc.
- Be sure to document the related pieces of how to configure items on the CyberArk side, and on the Splunk side.
- Back up your Splunk XML for your dashboards. Ideally within a code repo like GitHub or GitLab.
- Take free Splunk training! See the link below.
Looking for a partner in your Privileged Access Management rollout?
Check out my site here — https://www.keyvaultsolutions.com/pages/contact-us
Related CyberArk Documentation —
- My related blog on how to send syslog to Splunk Cloud:
https://medium.com/@aglerj/how-to-forward-cyberark-vault-logs-to-splunkcloud-4cc79e04ea28 - Where are all the CyberArk logs?:
https://cyberark-customers.force.com/s/article/Where-do-I-find-the-logs - Free Splunk Training — https://www.splunk.com/en_us/training/free-courses/overview.html